Transparency Scorecard
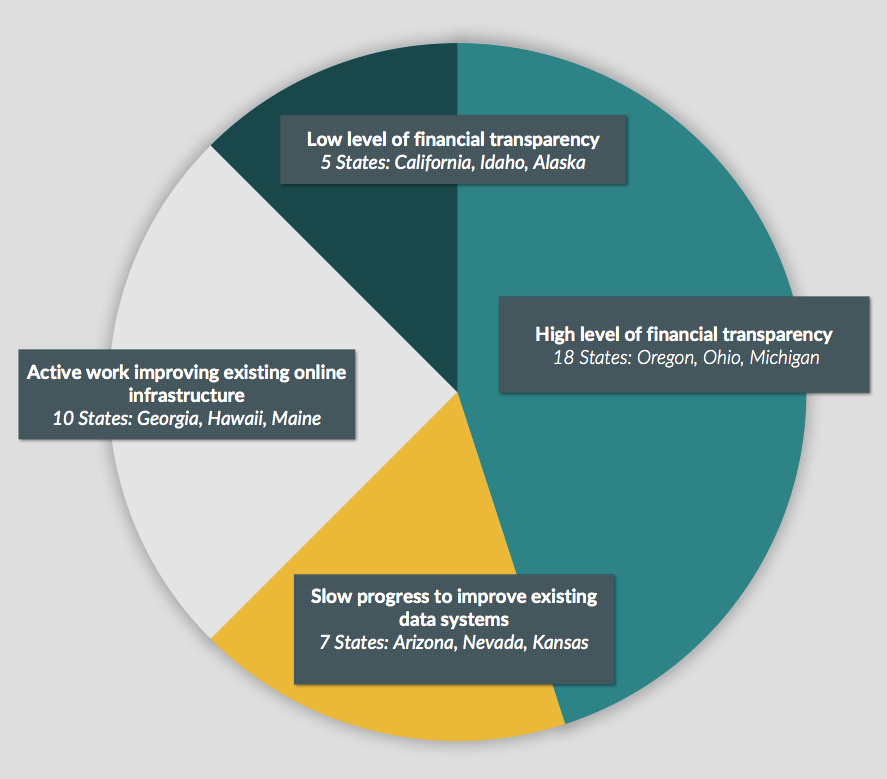
Late summer 2017, we began investigating government financial transparency status quo by reviewing the US state open financial data and policies. From this research, we created our own transparency scorecard regarding the implementation of open data practices at the state level.
As reference, we reviewed the 2016 PIRG Following the Money report; in which Oregon, Michigan, Indiana, and Ohio, each scored a perfect 100. PIRG is looking for the availability of online spending data and scoring states based on four attributes: is the data available in one place, is all the data available that should be online, is the metadata searchable, and can the data be downloaded.

As we reviewed all the states, we found these key problems
- data is difficult to access
- tax and checkbook data is not available
- no single pane of glass to view all data is in one online place
- formatting is inconsistent and not well documented

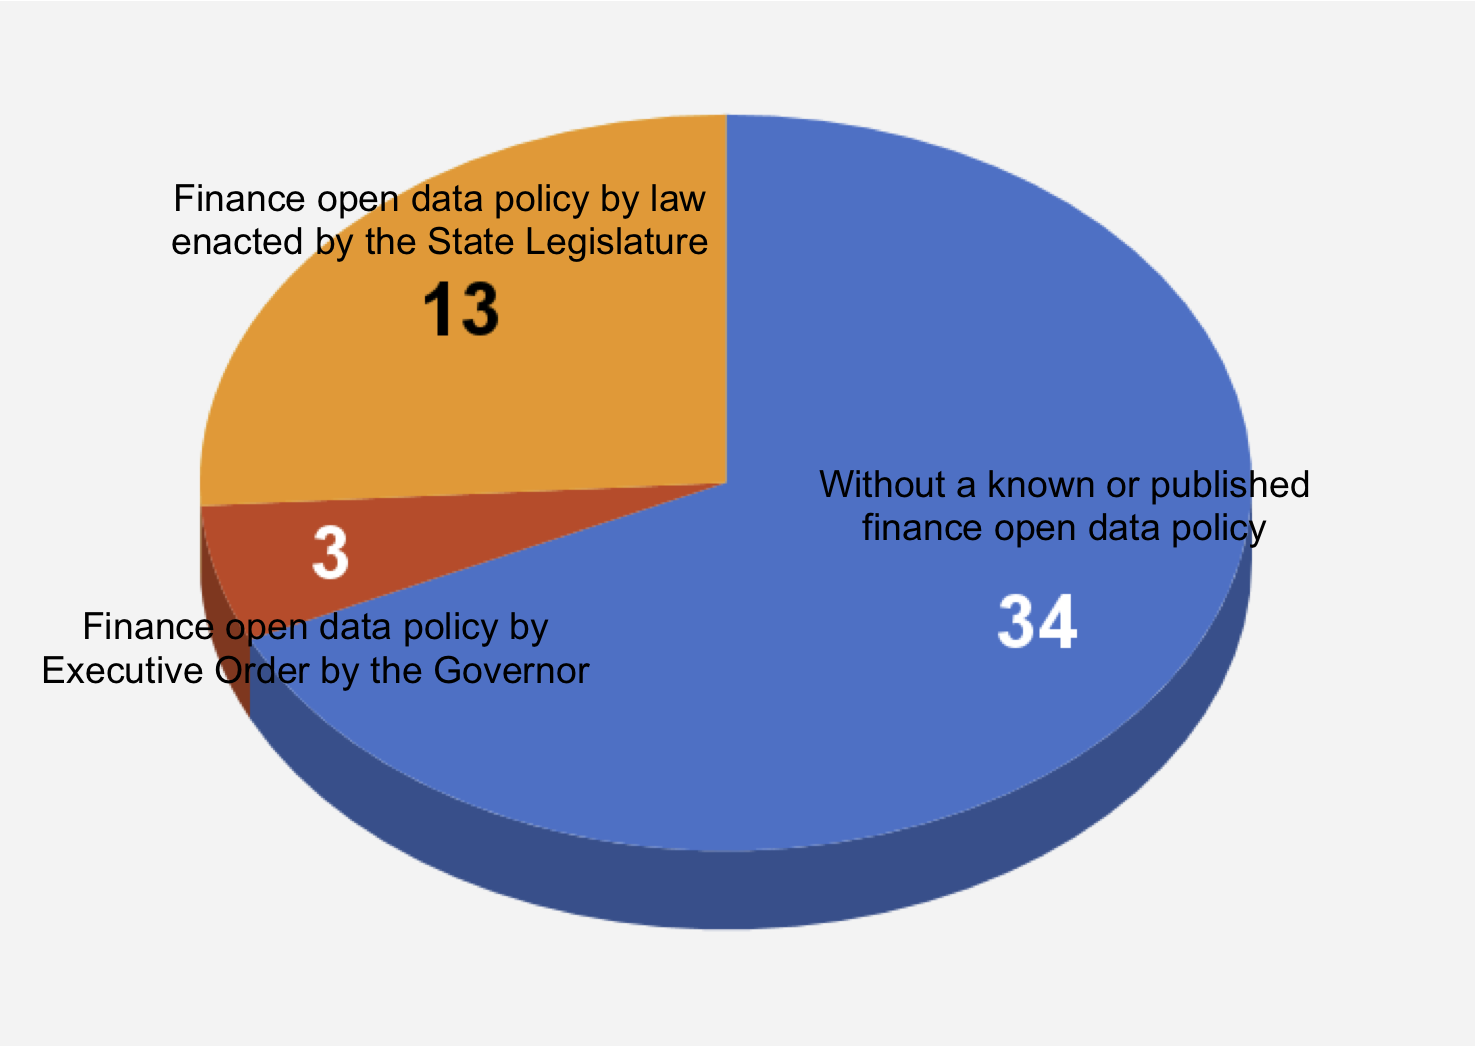
We also wanted to understand what is driving the financial transparency policy at the state level. Is there a policy by law, by edict of an elected official, or is there no policy at all?
- There are 34 states without a known or published finance open data policy. With more investigation, a policy may or may not be found. 9 of the 34, appear to have outsourced their finance open data policy to a technology contractor
- 16 states have a some form of a published finance open data policy. The policy is either by Executive Order by the Governor (3) or by law enacted by the State Legislature (13)
- With more investigation working with policy experts, more state finance open data policy may be found. The information found so far was published by the state in some form online
Our review of California:
California was ranked as the state with the worst financial transparency according to the PIRG report. Even with attempted legislation in the Fall of 2015 and “step by step” progress they lag far behind states with the best financial transparency. California needs to streamline all their expenditures into one portal. The state database provides helpful maps and graphics for general overviews of expenditures, but it does not provide easy access to the details. California also does not provide access to the effects of tax credits and exemptions on the state budget according to the PIRG report. They also need to improve their accessibility through a web search. After the resolution of the accessibility issue, the exportability and usability of data need to be addressed. Multiple tabs had to be checked to find the proper website. California could also use a comment and suggestion option.
Our review of Alaska:
Alaska also received a failing grade from the PIRG report for a multitude of reasons. According to our research Alaska had policy that required the annual comprehensive financial report but it is unknown when that legislation was passed. Alaska’s online checkbook is difficult to find through an online search. Alaska’s website is the worst part of their financial database. It is outdated and not easy to look at. This would be the primary thing to improve when it comes to complying with the open data act. Graphics, interactive maps, and drop down tabs would all benefit this website tremendously. The website is copyrighted from 2011. The information is set up in PDF format which is good for analysing everything but there could be a more efficient way to find the information quickly and effectively.
Our review of Idaho:
Idaho is another failing state for financial transparency. The PIRG report states that Idaho’s website is difficult to find when just doing a straight internet search. They also do not provide information on how tax exemptions, credits, and deductions impact the state budget as the other high ranking states do. Idaho does not have any known policy that is dedicated to the financial transparency of the state. Idaho’s is very outdated and has a poor layout. This could be developed into a much more user friendly interface. Everything is in PDF format which is okay if the entire report is needed but does not bode well for the person trying to find specific details. The website needs an updated interface that takes advantage of graphics and more specific dropdown tab choices.
We will continue developing and expanding our Transparency Scorecard through surveys of government municipalities with a review of Ohio and California. This information will continue to be publicly available.